Motivgalerie für Ihre Fototapete
Motivgalerie für Ihre Fototapete günstig
Motivgalerie für Ihre Fototapete selbstklebend
Fototapeten direkt vom Hersteller

MOTIV INFO »
file=445181646&lizenz=10&&width=9501&height=5209&link=https://as1.ftcdn.net/v2/jpg/04/45/18/16/500_F_445181646_Y59SoG7xY4fxWW1zLRGlVBPTCFtvmWmC.jpg|

MOTIV INFO »
file=520874410&lizenz=10&&width=-2328&height=-2000&link=https://as1.ftcdn.net/v2/jpg/05/20/87/44/500_F_520874410_1JvtVHxwU9NVOWaMg2ZAcZwyIxX2gzED.jpg|

MOTIV INFO »
file=389312308&lizenz=10&&width=-4000&height=-2000&link=https://as2.ftcdn.net/v2/jpg/03/89/31/23/500_F_389312308_PSL8PTfrwRg6f3IjwbGdze7olvDeIJxX.jpg|
MOTIV INFO »
file=713616158&lizenz=10&&width=-3873&height=-3873&link=https://as2.ftcdn.net/v2/jpg/07/13/61/61/500_F_713616158_0BziZABOaqTvQsHD4btE4WLrmbHEbk6n.jpg|

MOTIV INFO »
file=745136364&lizenz=10&&width=-3873&height=-3873&link=https://as2.ftcdn.net/v2/jpg/07/45/13/63/500_F_745136364_43XMaxK7RinsDrTqYn0BXN78a13IAZ5Z.jpg|
MOTIV INFO »
file=214856258&lizenz=10&&width=-5906&height=-5906&link=https://as1.ftcdn.net/v2/jpg/02/14/85/62/500_F_214856258_sBGJ1Rg41dgaTTvGOLtQ3C4endMmuHUc.jpg|

MOTIV INFO »
file=694246332&lizenz=10&&width=-5815&height=-2579&link=https://as2.ftcdn.net/v2/jpg/06/94/24/63/500_F_694246332_I4jcH1PB7CnGtF4XI8Dt4vaRXr5bl0DU.jpg|

MOTIV INFO »
file=267673008&lizenz=10&&width=-5667&height=-4584&link=https://as1.ftcdn.net/v2/jpg/02/67/67/30/500_F_267673008_hVkgzertSYgarZIJtHlTki1QEgC21jlZ.jpg|

MOTIV INFO »
file=525448089&lizenz=10&&width=-4910&height=-4901&link=https://as1.ftcdn.net/v2/jpg/05/25/44/80/500_F_525448089_pSHcT7yWTHPTDHCzaOS6oTCfwewbZhwD.jpg|
MOTIV INFO »
file=98329356&lizenz=10&&width=5000&height=3750&link=https://as2.ftcdn.net/v2/jpg/00/98/32/93/500_F_98329356_DNyFB4uFUfm1AoJaNFPNcNO31soyY4wb.jpg|

MOTIV INFO »
file=275891576&lizenz=10&&width=-8000&height=-4500&link=https://as2.ftcdn.net/v2/jpg/02/75/89/15/500_F_275891576_ccHNDC2ZrT25Ut9t8TatdpkZflNx6hrY.jpg|

MOTIV INFO »
file=264842534&lizenz=10&&width=-600&height=-600&link=https://as2.ftcdn.net/v2/jpg/02/64/84/25/500_F_264842534_pxE18YRw07NCkK4OmziLi94oOTVMpDcV.jpg|
MOTIV INFO »
file=57506114&lizenz=10&&width=-10044&height=-4000&link=https://as2.ftcdn.net/v2/jpg/00/57/50/61/500_F_57506114_xFy0mYH7T7WG3wZMgnJohpZ00WY9dFkR.jpg|

MOTIV INFO »
file=419214715&lizenz=10&&width=-10418&height=-3543&link=https://as2.ftcdn.net/v2/jpg/04/19/21/47/500_F_419214715_GRdz8pHT8FkERskNTTSxoFR6ZehHvRS2.jpg|

MOTIV INFO »
file=814793728&lizenz=10&&width=-3162&height=-4743&link=https://as2.ftcdn.net/v2/jpg/08/14/79/37/500_F_814793728_WPWmeHTZgVJrKR8f4MsDx9061OL3G32c.jpg|
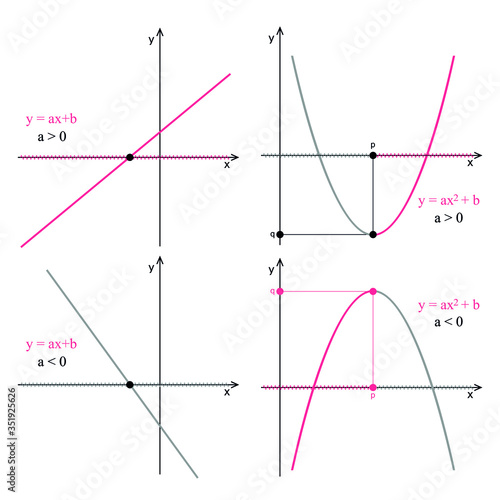
MOTIV INFO »
file=351925626&lizenz=10&&width=-3969&height=-3969&link=https://as1.ftcdn.net/v2/jpg/03/51/92/56/500_F_351925626_vPOsW41rqsEqJ1k3IbkdLVZuNNB1G5g1.jpg|

MOTIV INFO »
file=475675453&lizenz=10&&width=-7292&height=-3126&link=https://as1.ftcdn.net/v2/jpg/04/75/67/54/500_F_475675453_A8oBx033pXtwMbYAVhAaTIPbxBQYHluS.jpg|
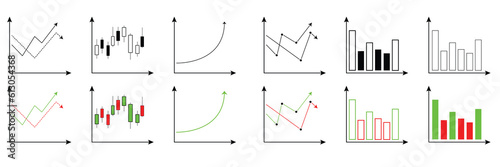
MOTIV INFO »
file=613054368&lizenz=10&&width=-6708&height=-2236&link=https://as2.ftcdn.net/v2/jpg/06/13/05/43/500_F_613054368_xtl2sKMfddlvP2TXBO6Vu3vW6R7lWIBU.jpg|

MOTIV INFO »
file=210450254&lizenz=10&&width=-8333&height=-4167&link=https://as1.ftcdn.net/v2/jpg/02/10/45/02/500_F_210450254_bXW65G2PKrlel1cuJPzIO0ijNwO8Q1Rs.jpg|

MOTIV INFO »
file=528724769&lizenz=10&&width=5111&height=3000&link=https://as2.ftcdn.net/v2/jpg/05/28/72/47/500_F_528724769_75rUd4rCWTIDKefWifPFkzkabGmaVSXX.jpg|

MOTIV INFO »
file=182411942&lizenz=10&&width=-7631&height=-3342&link=https://as2.ftcdn.net/v2/jpg/01/82/41/19/500_F_182411942_WKAoOdb6XWt0GZetxS7OWU8uChFLSrEo.jpg|
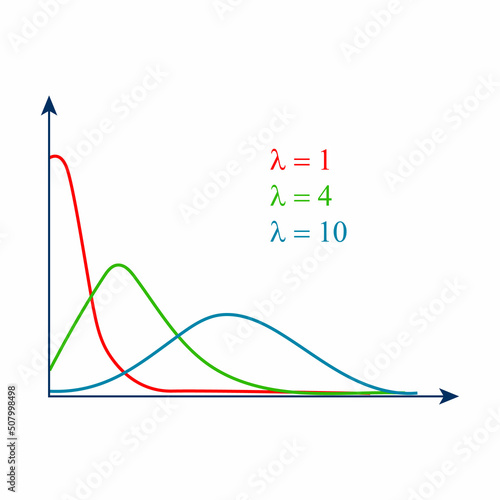
MOTIV INFO »
file=507998498&lizenz=10&&width=-5000&height=-5000&link=https://as1.ftcdn.net/v2/jpg/05/07/99/84/500_F_507998498_FiWJG6MZv8phgW3WiWdXw9puJDwKOSUG.jpg|

MOTIV INFO »
file=166778739&lizenz=10&&width=-4000&height=-4000&link=https://as2.ftcdn.net/v2/jpg/01/66/77/87/500_F_166778739_FJdPhWJIH3NSikRR9paw70YoC9tFA0VG.jpg|
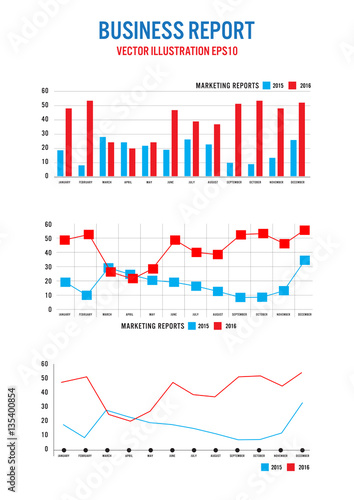
MOTIV INFO »
file=135400854&lizenz=10&&width=-5848&height=-8268&link=https://as1.ftcdn.net/v2/jpg/01/35/40/08/500_F_135400854_8MueoFy3Nn0DksUv1nBbPTTnN2u9XLuW.jpg|

MOTIV INFO »
file=516039973&lizenz=10&&width=-5000&height=-4000&link=https://as2.ftcdn.net/v2/jpg/05/16/03/99/500_F_516039973_tKOlEhvs7udug9HeDVpD2fX7L4YlJGEA.jpg|
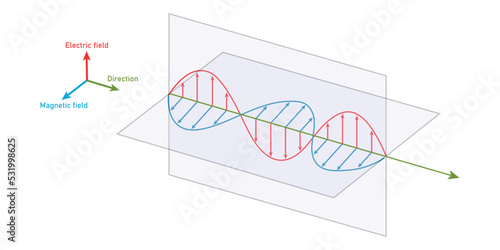
MOTIV INFO »
file=531998625&lizenz=10&&width=-6563&height=-3283&link=https://as1.ftcdn.net/v2/jpg/05/31/99/86/500_F_531998625_yRoKneBVKsXSx385v8YoacG4Oz3TRqKS.jpg|

MOTIV INFO »
file=681335572&lizenz=10&&width=3000&height=3000&link=https://as2.ftcdn.net/v2/jpg/06/81/33/55/500_F_681335572_11Jf5yxjWb0pssvEeLESh3fGxnBp5F2c.jpg|

MOTIV INFO »
file=298919571&lizenz=10&&width=-5209&height=-3473&link=https://as2.ftcdn.net/v2/jpg/02/98/91/95/500_F_298919571_0PhQR50xhaCUEzKYMRy9hnroiEcc1Ekr.jpg|

MOTIV INFO »
file=166827833&lizenz=10&&width=4288&height=2752&link=https://as1.ftcdn.net/v2/jpg/01/66/82/78/500_F_166827833_voS4W9h3yd0shUdBkZXGDjjVGNWFQ9IC.jpg|
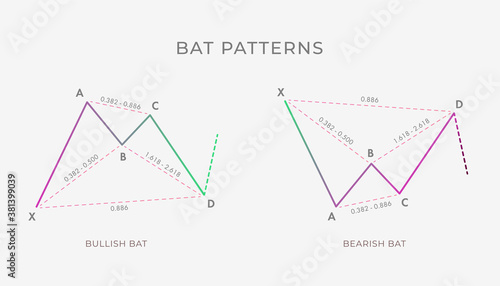
MOTIV INFO »
file=381399039&lizenz=10&&width=-7000&height=-4000&link=https://as1.ftcdn.net/v2/jpg/03/81/39/90/500_F_381399039_ntZuJHoZS9iLx1NpJF4F0KEeJDIrD7dq.jpg|

MOTIV INFO »
file=249875616&lizenz=10&&width=9000&height=6000&link=https://as1.ftcdn.net/v2/jpg/02/49/87/56/500_F_249875616_fywRVuKRVk68m94afBozxjwwSoPNFAWk.jpg|

MOTIV INFO »
file=708199495&lizenz=10&&width=-4603&height=-3259&link=https://as1.ftcdn.net/v2/jpg/07/08/19/94/500_F_708199495_fR04euiH7MkoTDJc5vWOu0pgVIyuYOqE.jpg|
Sie können ein eigenes Motiv hochladen. Alternativ bietet die Galerie unseres Partners Adobe unverbindlich eine Vielfalt von Motiven zu Ihrer Auswahl an. Bitte beachten sie bei der Motivauswahl die FotoNet-Philosophie.
In unserem Fotolabor können Sie in wenigen Minuten Ihre Fototapete drucken lassen. Wir verwenden moderne Fototapetedruck Techniken für die Entwicklung und Druck von Digitalfotos und Poster. Sie können auch Abzüge Ihrer Fototapete nachbestellen. Lassen auch Sie sich von unserem Foto Service überzeugen und bestellen Sie in unserem Fotolabor Ihre Fototapete.